Carbon Intensity is not Carbon Risk Exposure
Executive summary
The concept of “carbon risk”, financial risk to companies associated with the transition to a low-carbon economy, has steadily grown in the Environmental, Social, and Governance (ESG) and responsible investing fields in recent years. With this increasing interest, the number of commercial providers offering solutions for investors to assess their carbon risk exposure has increased in turn, with many relying on available data such as GHG emissions at company level (carbon footprint, carbon intensity of sales, etc.) as a proxy for this risk. However, many factors affect corporate carbon risk and it is thus important to ask whether such metrics are indeed a good and direct proxy for carbon risk. This report reviews how analysts, over a large set of reports published between 2003 and 2015, have assessed carbon risk and opportunity and how strong a relationship exists with corporate GHG emissions.
1. Carbon risk assessments and carbon intensity
1.1 Objective of the report
The concept of “carbon risk” has steadily grown in the Environmental, Social, and Governance (ESG) and responsible investing fields in recent years. Carbon risk is generally defined as the financial risk to companies associated with the transition to a low-carbon economy (excluding physical risks, generally called “climate risks”) and, in the case of equity, the impact of this risk on stock financial performance.
Recent reviews of the topic have described the various drivers for such risk (policy, technology, and market) as well as quantitative methods (primarily scenario-based stress tests at asset, company/security, or portfolio levels) that can be used to assess such risk.
As the concept of carbon risk has been popularized, institutional investors have faced a choice of how to assess its materiality and potentially manage it. ESG data providers, largely building off the growing availability of nonfinancial/CSR reporting data,iv have stepped in to offer data and services, often buoyed by investor coalitions. One metric and method achieving increased prominence in the discussion has been “portfolio carbon footprinting”, a term used broadly to mean portfolio-level GHG emissions associated with investee companies, projects, etc. For instance, the PRI Montreal Carbon Pledge explicitly states that “in order to better understand, quantify and manage the carbon and climate change related impacts, risks and opportunities in our investments, it is integral to measure our carbon footprint.”
1.2 Methodology
The authors identified more than 240 reports on carbon risk published by brokerage houses, thinktanks, and other research firms (see Annex). However, as the analysis focuses on carbon risk assessments specifically for corporates and required a cross-sectional ranking of companies, only a small fraction (38) of all the reports were kept for the purpose of the study (see Appendix). While the exhaustiveness of the literature review cannot be guaranteed, our analysis suggests the selected reports are likely representative of practitioners’ work over the last 10 years.
1.3 Result: A modest correlation between carbon footprint and carbon risk
On a concentrated panel of 20 selected reports on carbon risk published between 2003 and 2015, the degree of correlation of company rankings between the carbon risk and carbon sales intensity is modest at best, with an average across studies of around 0.2 in the year of publication (year N). Importantly, even this small correlation is uncertain—as some studies actually show a negative correlation, meaning higher carbon intensity firms are on average rated as lower carbon risk by the report’s authors.
One could expect this correlation to improve with time, as analyst rankings are intended to be forward-looking. However, as Chart 1 shows, the correlation between carbon intensity and carbon risk hardly varies for five years after the publication of the study (+/- 11% of standard deviation over time).
2. Can carbon sales intensity help identifying opportunities?
A negative risk, or to be more precise a negative impact on risk and hence a lower risk, is a financial opportunity. The analysis further considers 18 additional studies that identified companies positively impacted by carbon risk (opportunities).
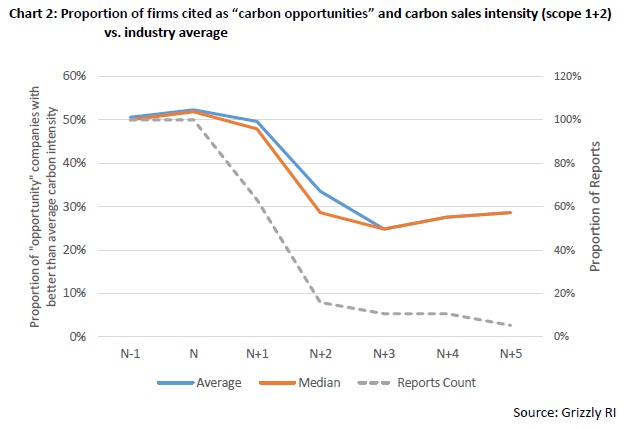
Again, data suggest that the carbon sales intensity (scope 1 + 2) does not help in detecting companies identified as carbon opportunities (Chart 2). As shown in Chart 2, only half of the companies presented as “carbon opportunities” have a better carbon sales intensity (scope 1+2) than their sector average. In short, the relationship between identified “carbon opportunities” and carbon intensity is no better than a coin flip—half the “opportunity” companies are better than sector average, half are worse.
3. What about Scope 3?
At least in the case of carbon opportunities, and in the case of fossil fuel sector carbon risk, part of the lack of relationship between carbon intensity and assessed risk can be interpreted as a discrepancy between companies’ internal operations (i.e. Scope 1 and 2 emissions) and emissions associated with their products (i.e. downstream Scope 3 emissions). In the case of risk, this is why many ESG providers offer assessments of either total reserves or the GHG associated with such reserves. Similarly, for carbon opportunities analysts often examine companies’ current and future product offerings rather than their internal operations.
To download the full report, please click here.


